Metabolic interactions in the tumor microenvironment
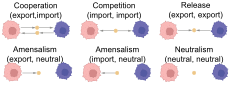
Explore metabolic interactions within the tumour microenvironment by analyzing the exchange of metabolites between spatially adjacent spots.
|
|
[ ]:
%load_ext autoreload
%autoreload
import matplotlib.pyplot as plt
import seaborn as sns
import scanpy as sc
import pandas as pd
import spmetatme.plotting as pl

import warnings
warnings.simplefilter(action='ignore', category=FutureWarning)
warnings.filterwarnings("ignore")

BATCH_SIZE = 80
K = 150
c:\Users\suraj\anaconda3\envs\spatialEnv\Lib\site-packages\tqdm\auto.py:21: TqdmWarning: IProgress not found. Please update jupyter and ipywidgets. See https://ipywidgets.readthedocs.io/en/stable/user_install.html
  from .autonotebook import tqdm as notebook_tqdm
Load Spatial metabolic fluxes
[ ]:
metabolic_adata = sc.read_h5ad(r"output/metabolic_Breast_cancer_Block_A.h5ad")
interaction_type = pd.read_parquet("output/interaction_type_Breast_cancer_Block_A.parquet")
interaction_scores = pd.read_parquet("output/Interaction_score_Breast_cancer_Block_A.parquet")
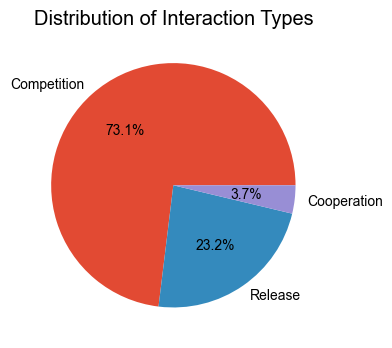
Visualise the distribution of Interaction Types
[23]:
counts = interaction_type['Interaction type'].value_counts()
plt.figure(figsize=(4, 4))
plt.pie(
    counts,
    labels=counts.index,
    autopct='%1.1f%%',
    counterclock=True
)
plt.title("Distribution of Interaction Types")
plt.tight_layout()
plt.show()
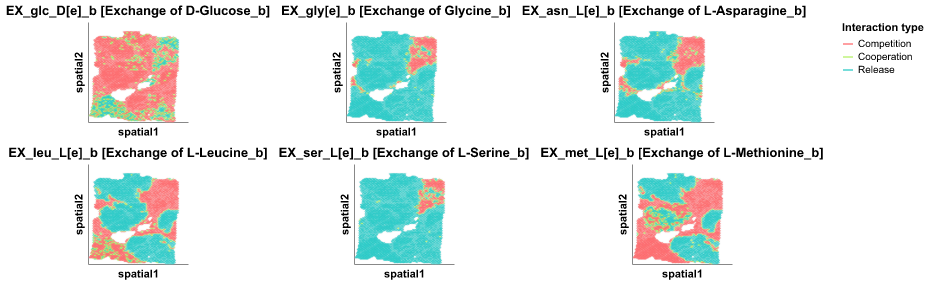
Tissue-level Metabolic Interaction Types for selected exchange reactions
[31]:
reactions = ['EX_glc_D[e]','EX_gly[e]_f','EX_asn_L[e]_f','EX_leu_L[e]_f','EX_ser_L[e]_f','EX_met_L[e]_f']
chart = pl.plot_TME_interactions(metabolic_adata, interaction_type, interaction_scores, percentile_threshold=95, reactions = reactions, cols=3, save_path="global_interaction-types_Breast_cancer_Block_A_domain_1.png")
chart
[31]:
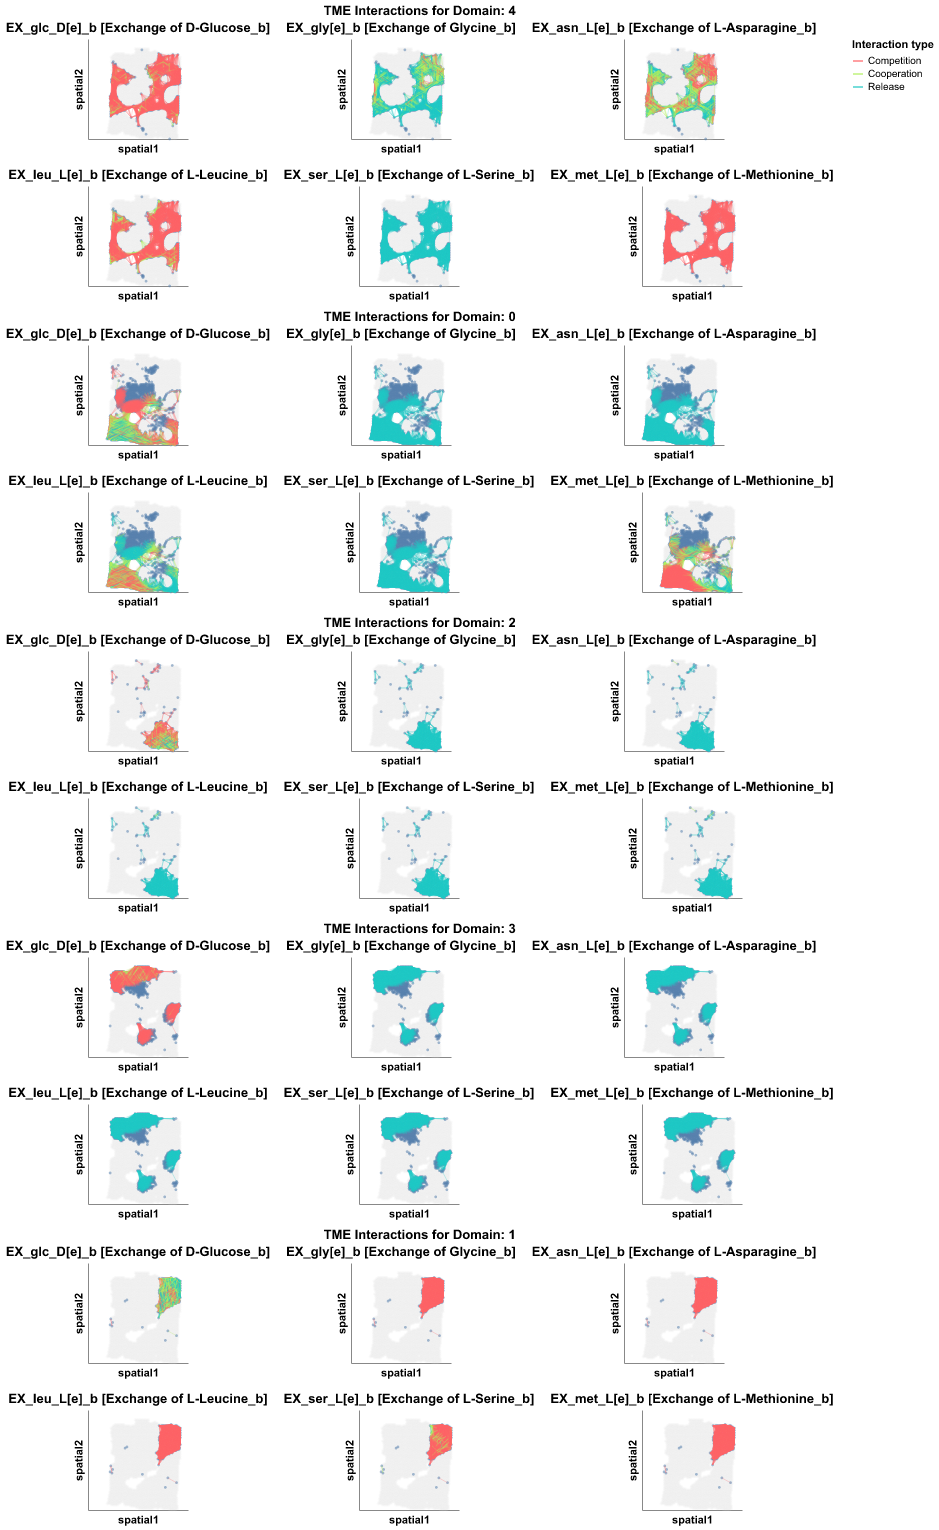
Domain-wise Metabolic Interaction Types for selected exchange reactions
[ ]:
reactions = ['EX_glc_D[e]','EX_gly[e]_f','EX_asn_L[e]_f','EX_leu_L[e]_f','EX_ser_L[e]_f','EX_met_L[e]_f']
charts = pl.plot_TME_domain_interactions(metabolic_adata, interaction_type, interaction_scores, reactions = reactions, key='domain', show_background=True, use_rxn_names=True, cols=3, save_path="TME_interaction-types_domain_Breast_cancer_Block_A_of_interest.png")
charts.display()
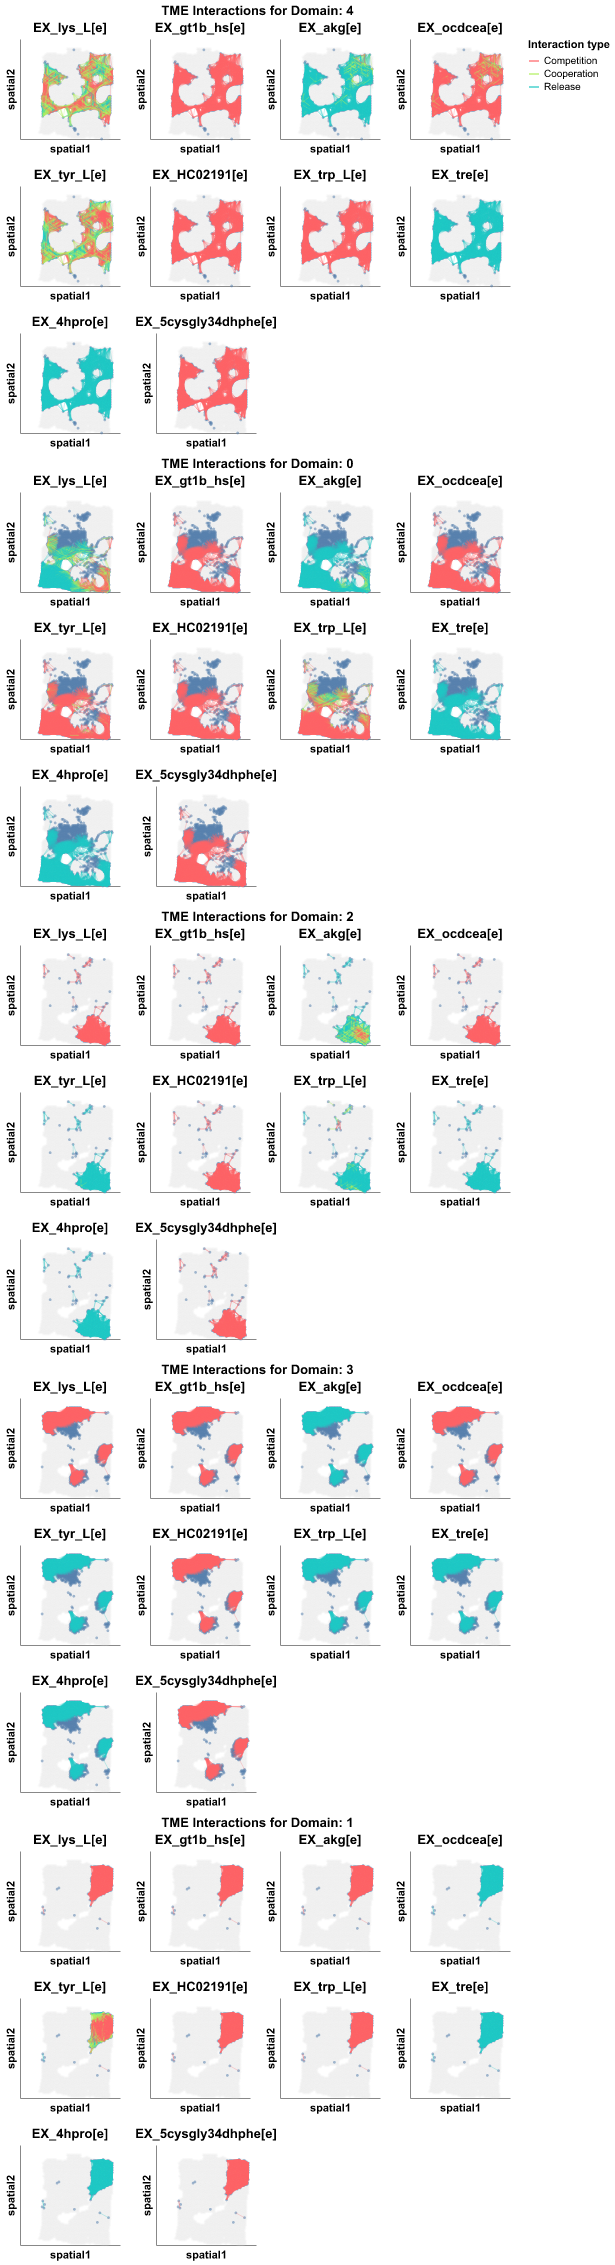
Investigate the metabolic interaction types of top n (n = 2) exchange reactions differentially enriched in each domain.
[27]:
charts = pl.plot_TME_domain_interactions(metabolic_adata, interaction_type, interaction_scores, key='domain', show_background=True, use_rxn_names=False, cols=4, save_path="TME_interaction-types_domain_Breast_cancer_Block_A_diff_expr.png")
charts.display()
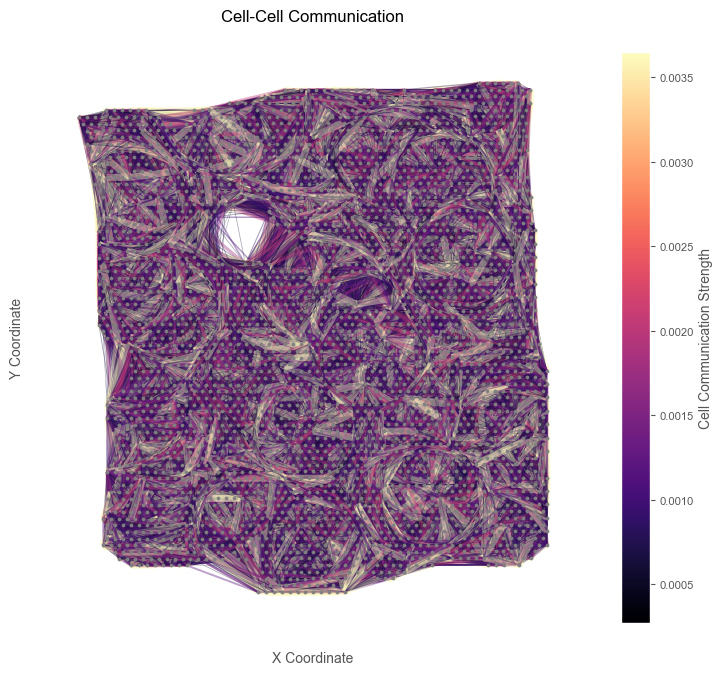
Quantify Metabolic Communication in the Tissue
Create a network visualization of metabolic communication between spatial regions:
Edge Weight: Indicates strength of metabolic interaction
[32]:
pl.plot_cell_communication(interaction_scores, metabolic_adata, figsize=(8, 8), save_path="metabolic_communication_Breast_cancer_Block_A.pdf")