Estimate Spatial Metabolic fluxes
Overview
This tutorial demonstrates the complete workflow for analyzing spatial metabolic transcriptomics data using SpMetaTME on breast cancer tissue. The analysis includes:
Data Loading & Preprocessing: Loading 10X Visium spatial transcriptomics data
Metabolic Modeling: Load pretrained spMetaTME model
Flux Inference: Predicting metabolic reaction fluxes across tissue spots
Domain Identification: Identifying spatially distinct metabolic domains
Interaction Inference: Finding metabolic interactions in the tumor microenvironment (TME)
Visualization & Analysis: Exploring metabolic heterogeneity across tissue
Dataset Information
Source: Breast cancer tissue measured with 10X Visium platform
Samples: Breast_cancer_Block_A
Dimensions: 3,798 cells (n_obs) × 19,690 genes (n_vars)
Key Features: High-resolution spatial coordinates with gene expression profiles
Import Required Libraries
Import essential packages for spatial transcriptomics analysis, metabolic modeling, and visualization:
scanpy: Spatial transcriptomics preprocessing and visualisations
matplotlib/seaborn: Data visualization
spmetatme: Python package for metabolic flux inference
plotting: Specialized visualization functionstrain: Model training and inferencecommunication: TME interaction analysisdataloader: Metabolic data loading utilities
Configuration Parameters:
BATCH_SIZE = 80: Number of spots/cells to be sampled per batch during model trainingK = 150: Number of nearest neighbors for spatial graph construction
[1]:
%load_ext autoreload
%autoreload
import matplotlib.pyplot as plt
import seaborn as sns
import scanpy as sc
import spmetatme.plotting as pl
from spmetatme.data.dataloader import MetabolicDataLoader
from spmetatme.train import SpMetaTME
from spmetatme.data.metabolic_model import get_model_path
from spmetatme.communication import infer_TME_interaction
from spmetatme.utils import preprocess_adata, get_available_metabolic_models

from spmetatme.utils import convert_symbol_to_ensg #(Optional)
import warnings
warnings.simplefilter(action='ignore', category=FutureWarning)
warnings.filterwarnings("ignore")

BATCH_SIZE = 80
K = 150
c:\Users\suraj\anaconda3\envs\Demo_env\Lib\site-packages\tqdm\auto.py:21: TqdmWarning: IProgress not found. Please update jupyter and ipywidgets. See https://ipywidgets.readthedocs.io/en/stable/user_install.html
  from .autonotebook import tqdm as notebook_tqdm
Explore Available Metabolic Models
List all pre-built metabolic models available in SpMetaTME. These genome-scale metabolic models (GEMs) represent cancer-specific metabolic networks and are used to predict reaction fluxes from spatial transcriptomics data.
[2]:
get_available_metabolic_models()
[2]:
| version | organism | number of reactions | number of metabolites | gene identifier type | description | |
|---|---|---|---|---|---|---|
| breast_cancer | 1.1 | Homo sapiens | 6561 | 2919 | Ensemble gene id | Genome-scale metabolic model of human breast c... |
| colon_adenocarcinoma | 1.1 | Homo sapiens | 6646 | 2872 | Ensemble gene id | Genome-scale metabolic model of human colon ad... |
| glioblastoma | 1.1 | Homo sapiens | 6102 | 2460 | Ensemble gene id | Genome-scale metabolic model of human glioblas... |
| low_grade_glioma | 1.1 | Homo sapiens | 5940 | 2460 | Ensemble gene id | Genome-scale metabolic model of human low grad... |
| lung_adenocarcinoma | 1.1 | Homo sapiens | 6145 | 2660 | Ensemble gene id | Genome-scale metabolic model of human lung ade... |
| lung_squamous_cell_carcinoma | 1.1 | Homo sapiens | 6170 | 2606 | Ensemble gene id | Genome-scale metabolic model of human lung squ... |
| ovarian_cancer | 1.1 | Homo sapiens | 5668 | 2323 | Ensemble gene id | Genome-scale metabolic model of human ovarian ... |
| pancreatic_adenocarcinoma | 1.1 | Homo sapiens | 6129 | 2594 | Ensemble gene id | Genome-scale metabolic model of human pancreat... |
| prostate_cancer | 1.1 | Homo sapiens | 7541 | 3460 | Ensemble gene id | Genome-scale metabolic model of human prostate... |
| skin_cutaneous_melanoma | 1.1 | Homo sapiens | 6342 | 2712 | Ensemble gene id | Genome-scale metabolic model of human skin cut... |
| kidney_renal_clear_cell_carcinoma | 1.1 | Homo sapiens | 7002 | 3043 | Ensemble gene id | Genome-scale metabolic model of human kidney_r... |
| human_model | 1.1 | Homo sapiens | 7002 | 2993 | Ensemble gene id | Curated generic human metabolic model. |
| mouse_model | 1.1 | Mus musculus | 6942 | 2759 | mouse gene symbols | Genome-scale metabolic model of mouse metabolism. |
Load and Preprocess Spatial Transcriptomics Data
Download Breast cancer spatial transcriptomis data from 10x genomics website (Spatial Gene Expression >> Visium Demonstration (v1 Chemistry) >> Space Ranger 1.0.0 >> Human Breast Cancer (Block A Section 1)). The preprocessing includes:
Gene ID mapping: If required, converting gene symbols to Ensembl IDs for metabolic model matching
Quality control: Filtering and normalization of expression data
MAGIC impute: Apply MAGIC imputation to impute sparse spatial transcriptomics data
Saving processed data: Caching preprocessed data for faster flux estimation
Convert gene symbols to Ensembl gene IDs (optional): Metabolic genes in metabolic models for Homo sapiens are represented using Ensembl gene IDs. If the genes in your
adataobject are provided as gene symbols, convert them to Ensembl gene IDs before analysis using functionconvert_symbol_to_ensg.
Data Specifications:
Input: Raw 10x visium spatial transcriptomics
Output: Preprocessed AnnData with 3,798 cells and 36,601 genes
Saved to:
BRCA_tissue_preprocessed.h5adfor use in metabolic modeling
[3]:
raw_adata_path =  r'..\\data\\BRCA_tissue.h5ad'
preprocessed_adata_path = r'..\\data\\BRCA_tissue_preprocessed.h5ad'
adata = preprocess_adata(sc.read_h5ad(raw_adata_path))


## If required convert gene symbol to ensemble gene id
# adata = convert_symbol_to_ensg(adata, var_name='symbol')


adata.var_names = adata.var.gene_ids
adata.write_h5ad(preprocessed_adata_path)
Number of cells after min count filter: 3798
Number of cells after gene filter: 3798
Number of genes after cell filter: 19690
Normalising data using log1p
Imputing the data using Magic imputation
  Running MAGIC with `solver='exact'` on 19690-dimensional data may take a long time. Consider denoising specific genes with `genes=<list-like>` or using `solver='approximate'`.
Load Tissue-Specific Metabolic Model
Retrieve the human breast cancer-specific metabolic model. This genome-scale metabolic model (GEMS) contains:
6561 reactions: Metabolic reactions including synthesis, degradation, and exchange reactions
2919 metabolites: Biological compounds involved in the reactions
[4]:
metabolic_path = get_model_path('breast_cancer')
Construct Metabolic Data Loader
Create a spatial metabolic data loader that integrates:
Spatial graph construction: Uses K-nearest neighbors (
K=150) to connect nearby tissue spotsMetabolic model integration: Links gene expression to metabolic reactions via GPR rules
Batch processing: Organises data into batches (
BATCH_SIZE=80) for efficient model training
Key Parameters:
adata_path: Union[str, Path, Sequence[Union[str, Path]]]: Path or list of paths to one or more AnnData objects. Supports both string and Path inputs, enabling flexible loading of single‑sample or multi‑sample spatial transcriptomics datasets.,metabolic_model_path: str: File path to the breast cancer metabolic model,k: int = 150: Number of nearest neighbors used to define the spatial graph topology. DefaultK = 150,batch_size: int = 50: Number of spots/cells to be sampled per batch within neighbourhood sampler during model training. Default batch size is 50.
[5]:
pred_data_loader = MetabolicDataLoader(preprocessed_adata_path,
                                       metabolic_model_path=metabolic_path,
                                       k=K,
                                       batch_size = BATCH_SIZE
                                       )
Infer Metabolic Fluxes and Identify Spatial Metabolic Domains
This is the core computational step using the SpMetaTME model to:
Load Pre-trained Model: Load a pre‑trained deep learning model from Hugging Face that was trained on human spatial transcriptomics data.
species:
humanormouseDefault species is
human
Optional Fine-tuning: Adapt the model to breast cancer tissue-specific patterns
Default: 10 epochs for fine-tuning
For larger tissues, increase epochs for better convergence
[ ]:
smt = SpMetaTME()
smt.load_pretrained_model("human")

## This is optional step to finetuen the pretrained model. For larger tissues, we recommend finetuning the pretrained model
# smt.fine_tune(pred_data_loader)
Seed set to 42
Using bfloat16 Automatic Mixed Precision (AMP)
GPU available: True (cuda), used: True
TPU available: False, using: 0 TPU cores
💡 Tip: For seamless cloud logging and experiment tracking, try installing [litlogger](https://pypi.org/project/litlogger/) to enable LitLogger, which logs metrics and artifacts automatically to the Lightning Experiments platform.
========================================================================
                       __  ___     __       ________  _________
           _________  /  |/  /__  / /_____ /_  __/  |/  / ____/
          / ___/ __ \/ /|_/ / _ \/ __/ __ `// / / /|_/ / __/
         (__  ) /_/ / /  / /  __/ /_/ /_/ // / / /  / / /___
        /____/ .___/_/  /_/\___/\__/\__,_//_/ /_/  /_/_____/
            /_/
  Spatial metabolic enrichment and interaction analysis within the TME
========================================================================
Flux Prediction: Estimate metabolic reaction fluxes and metabolite distribution for each spatial location
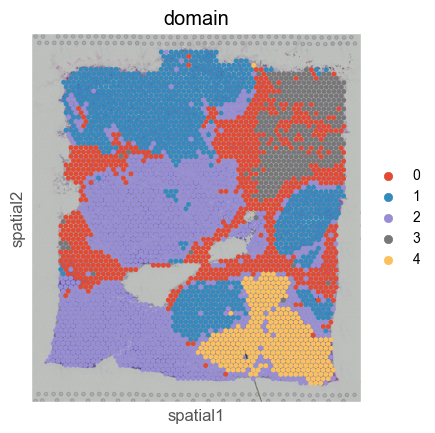
Spatial Domain Identification: Cluster the exchange reaction fluxes to identify metabolically distinct regions within the tissue
n_clusters=5: Determine the number of clusters. Identify 5 distinct metabolic domainsmethod='kmeans': K-means clustering on flux patterns.Other clustering methods are
mclust,leiden,louvainandspectral. To infer smaller number of clusters, prefer usingkmeans.
Moran’s I Statistic: Measures spatial autocorrelation of metabolic fluxes, quantifying domain coherence
Output: The spatial metabolic adata is save as .h5ad file format, compatable with scanpy library.
[7]:
metabolic_adata = smt.infer_flux(pred_data_loader, n_clusters=5, method='kmeans', file_name="Breast_cancer_Block_A.h5ad")
metabolic_adata
💡 Tip: For seamless cloud uploads and versioning, try installing [litmodels](https://pypi.org/project/litmodels/) to enable LitModelCheckpoint, which syncs automatically with the Lightning model registry.
LOCAL_RANK: 0 - CUDA_VISIBLE_DEVICES: [0]
identifying domains...
Completed clustering.
[7]:
AnnData object with n_obs × n_vars = 3798 × 6561
    obs: 'domain'
    var: 'rxn_id', 'rxn_names', 'rxn_full_names', 'ex_rxns', 'subsystems'
    uns: 'spatial', 'TME_metabolites', 'met_names', 'neighbors', 'moranI'
    obsm: 'ex_rxns', 'metabolites', 'spatial'
    obsp: 'communication', 'distances', 'connectivities'
spatial distribution of spatial metabolic domains
[8]:
sc.pl.spatial(metabolic_adata, img_key="hires", color=["domain"], size=1.5)
Infer Metabolic Interactions Between Spatial Regions
Discover metabolic interactions within the tumor microenvironment by analyzing the exchange of metabolites between spatially adjacent spots:
Interaction Scores: Quantifies the strength and directionality of metabolite exchange between spatially adjacent spots
Interaction Types: Identify the type of metabolic interactions across spatially adjacent spots.
[9]:
interaction_scores, interaction_type = infer_TME_interaction(metabolic_adata, file_name = 'Breast_cancer_Block_A')
Inferring metabolic interaction. Please wait, it may take a while
Inferring interactions: 100%|██████████| 569700/569700 [01:42<00:00, 5535.06it/s]
Interaction files are saved in output folder.