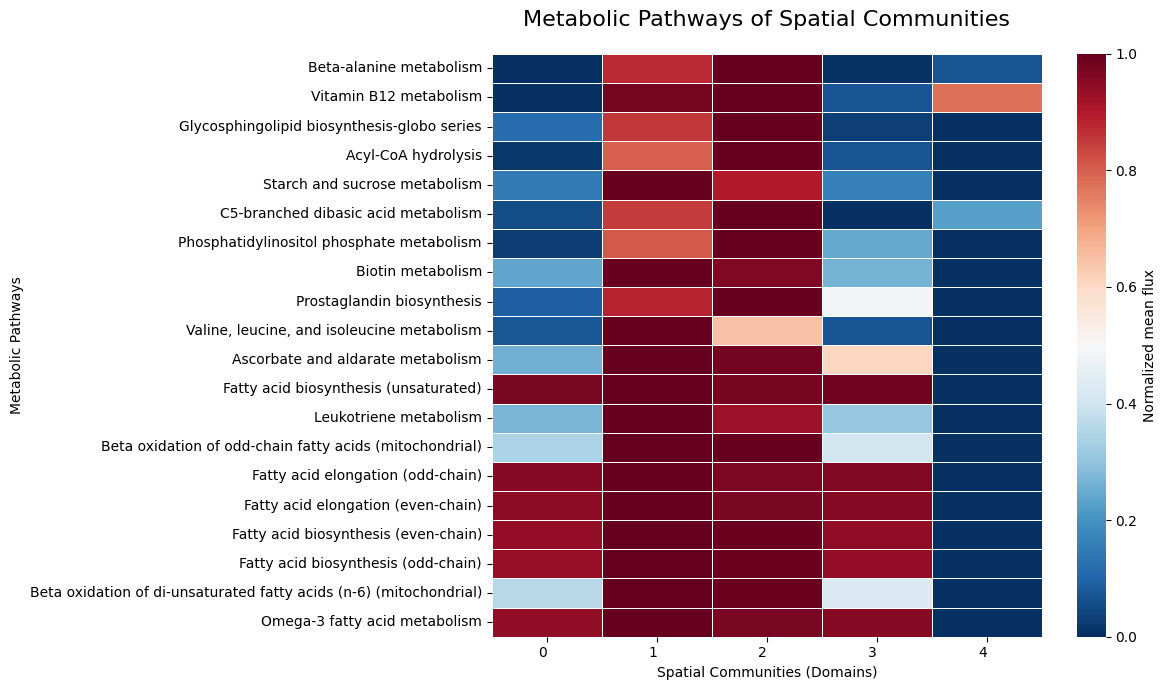
Metabolic Domains and Fluxes Analysis
[1]:
%load_ext autoreload
%autoreload
import pandas as pd
import scanpy as sc

import matplotlib.pyplot as plt
import seaborn as sns
import scanpy as sc
import spmetatme.plotting as pl


import warnings
warnings.simplefilter(action='ignore', category=FutureWarning)
warnings.filterwarnings("ignore")

BATCH_SIZE = 80
K = 150
Load Spatial metabolic fluxes
[2]:
metabolic_adata = sc.read_h5ad(r"output/metabolic_Breast_cancer_Block_A.h5ad")
interaction_type = pd.read_parquet("output/interaction_type_Breast_cancer_Block_A.parquet")
interaction_scores = pd.read_parquet("output/Interaction_score_Breast_cancer_Block_A.parquet")
Compute and Visualize UMAP Embeddings
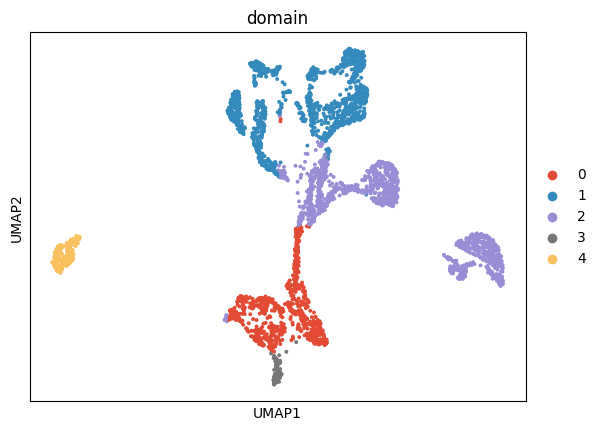
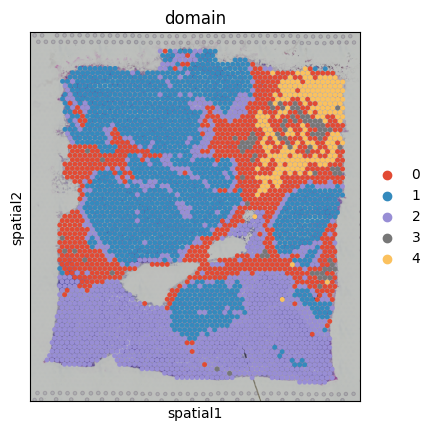
Generate dimensionality reduction visualizations to explore the structure of metabolic phenotypes:
UMAP Embedding: Non-linear dimensionality reduction based on exchange reaction fluxes (EX_RXNS)
Domain Spatial plot: Spatial visualisation of identified metabolic domain
Interpretation:
Tight clusters in UMAP indicate metabolically distinct cell types
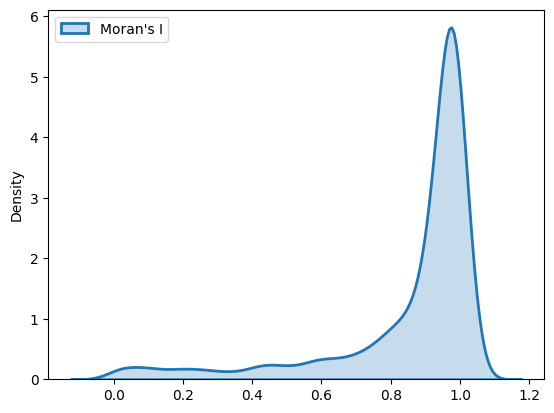
High Moran’s I values indicate spatially coherent metabolic domains
Spatial plot overlays domain assignments on tissue coordinates
[3]:
sc.pp.neighbors(metabolic_adata, n_neighbors=K ,use_rep='ex_rxns')
sc.tl.umap(metabolic_adata)
sc.pl.umap(metabolic_adata, color=["domain"], wspace=0.4, cmap='jet', save="_domain_umap_Breast_cancer_Block_A.pdf")
sc.pl.spatial(metabolic_adata, img_key="hires", color=["domain"], size=1.5, save="_spatial_domain_Breast_cancer_Block_A.pdf") #, "annotation"
WARNING: saving figure to file figures\umap_domain_umap_Breast_cancer_Block_A.pdf
WARNING: saving figure to file figures\show_spatial_domain_Breast_cancer_Block_A.pdf
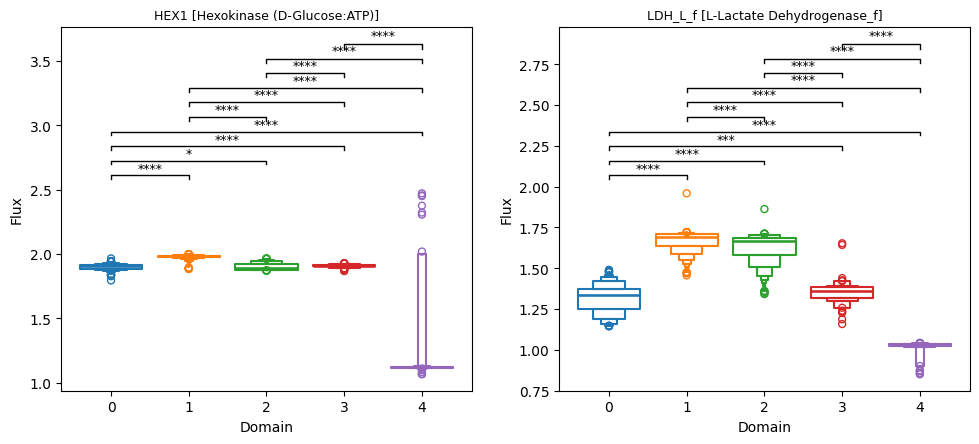
Metabolite distribution of reaction fluxes across domains
[4]:
fi = pl.plot_flux_distribution(metabolic_adata, ['HEX1','LDH_L_f'], n_col=2, file_name="flux_dist.pdf")
plt.show()
[5]:
sns.kdeplot(metabolic_adata.uns["moranI"], fill=True, color='teal', linewidth=2)
plt.savefig('figures/Breast_cancer_Block_A_Moran_kde.pdf')
plt.show()
[6]:
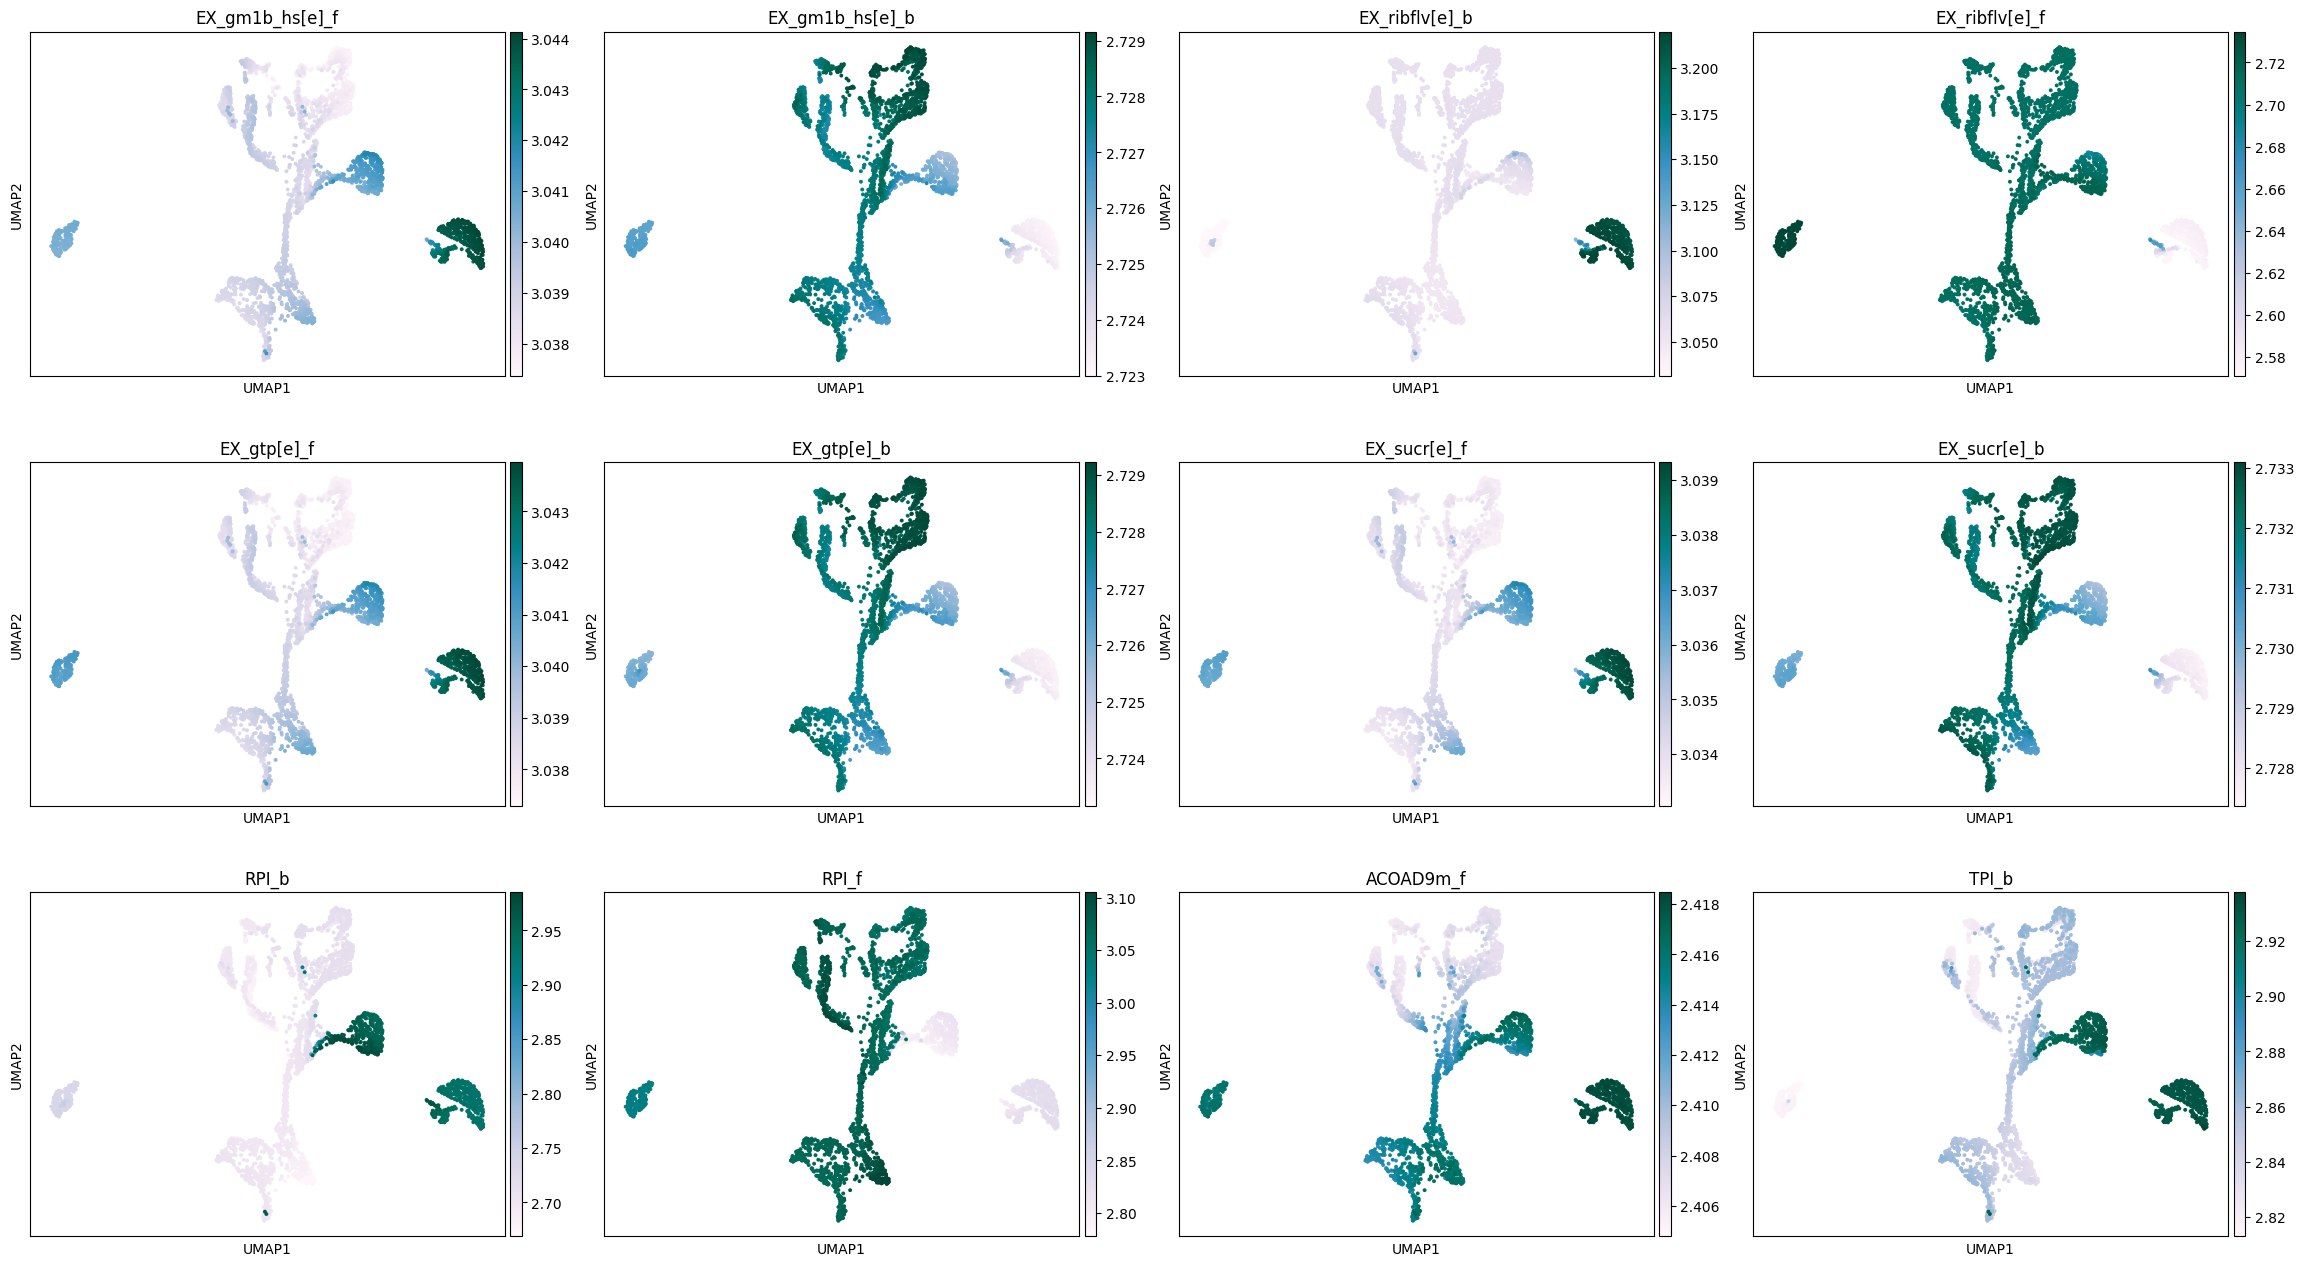
sc.pl.umap(metabolic_adata, color=['EX_gm1b_hs[e]_f', 'EX_gm1b_hs[e]_b','EX_ribflv[e]_b', 'EX_ribflv[e]_f','EX_gtp[e]_f','EX_gtp[e]_b','EX_sucr[e]_f','EX_sucr[e]_b','RPI_b','RPI_f','ACOAD9m_f','TPI_b'], wspace=0.1, cmap='PuBuGn', save="_domain_umap_Moran_reactions_Breast_cancer_Block_A.pdf")
WARNING: saving figure to file figures\umap_domain_umap_Moran_reactions_Breast_cancer_Block_A.pdf
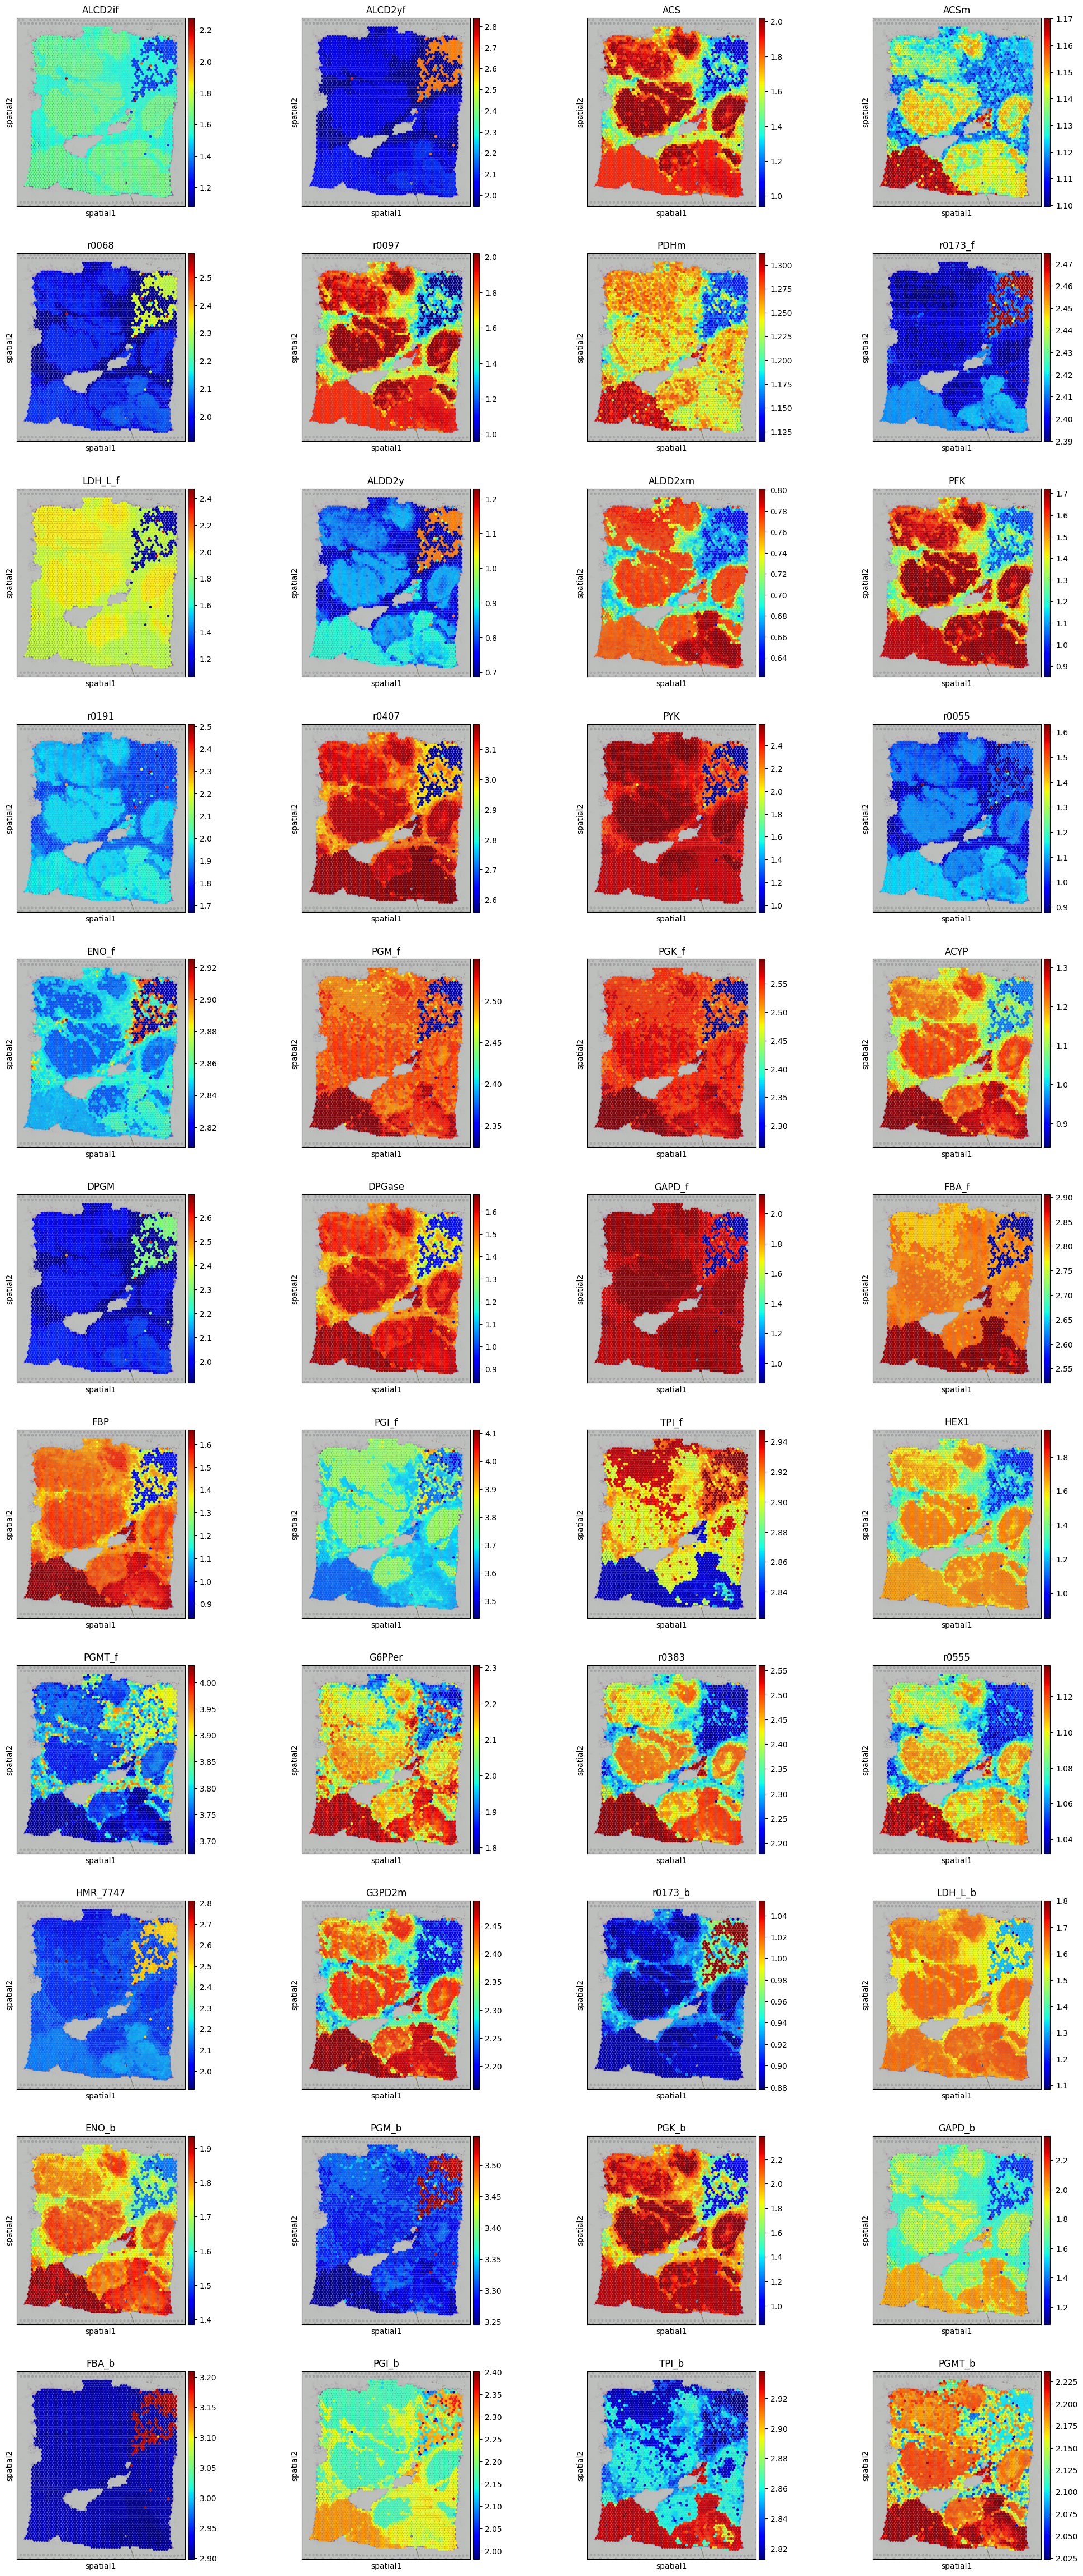
Spatial map view of reactions in “Glycolysis / Gluconeogenesis” pathway
[7]:
gly_rxns = metabolic_adata[:,metabolic_adata.var['subsystems'] == "Glycolysis / Gluconeogenesis"].to_df().columns
sc.pl.spatial(metabolic_adata, img_key = "hires", color = gly_rxns, size=1.5, cmap="jet", wspace=0.0, save="_spatial_glycolysis_Breast_cancer_Block_A.pdf")
WARNING: saving figure to file figures\show_spatial_glycolysis_Breast_cancer_Block_A.pdf
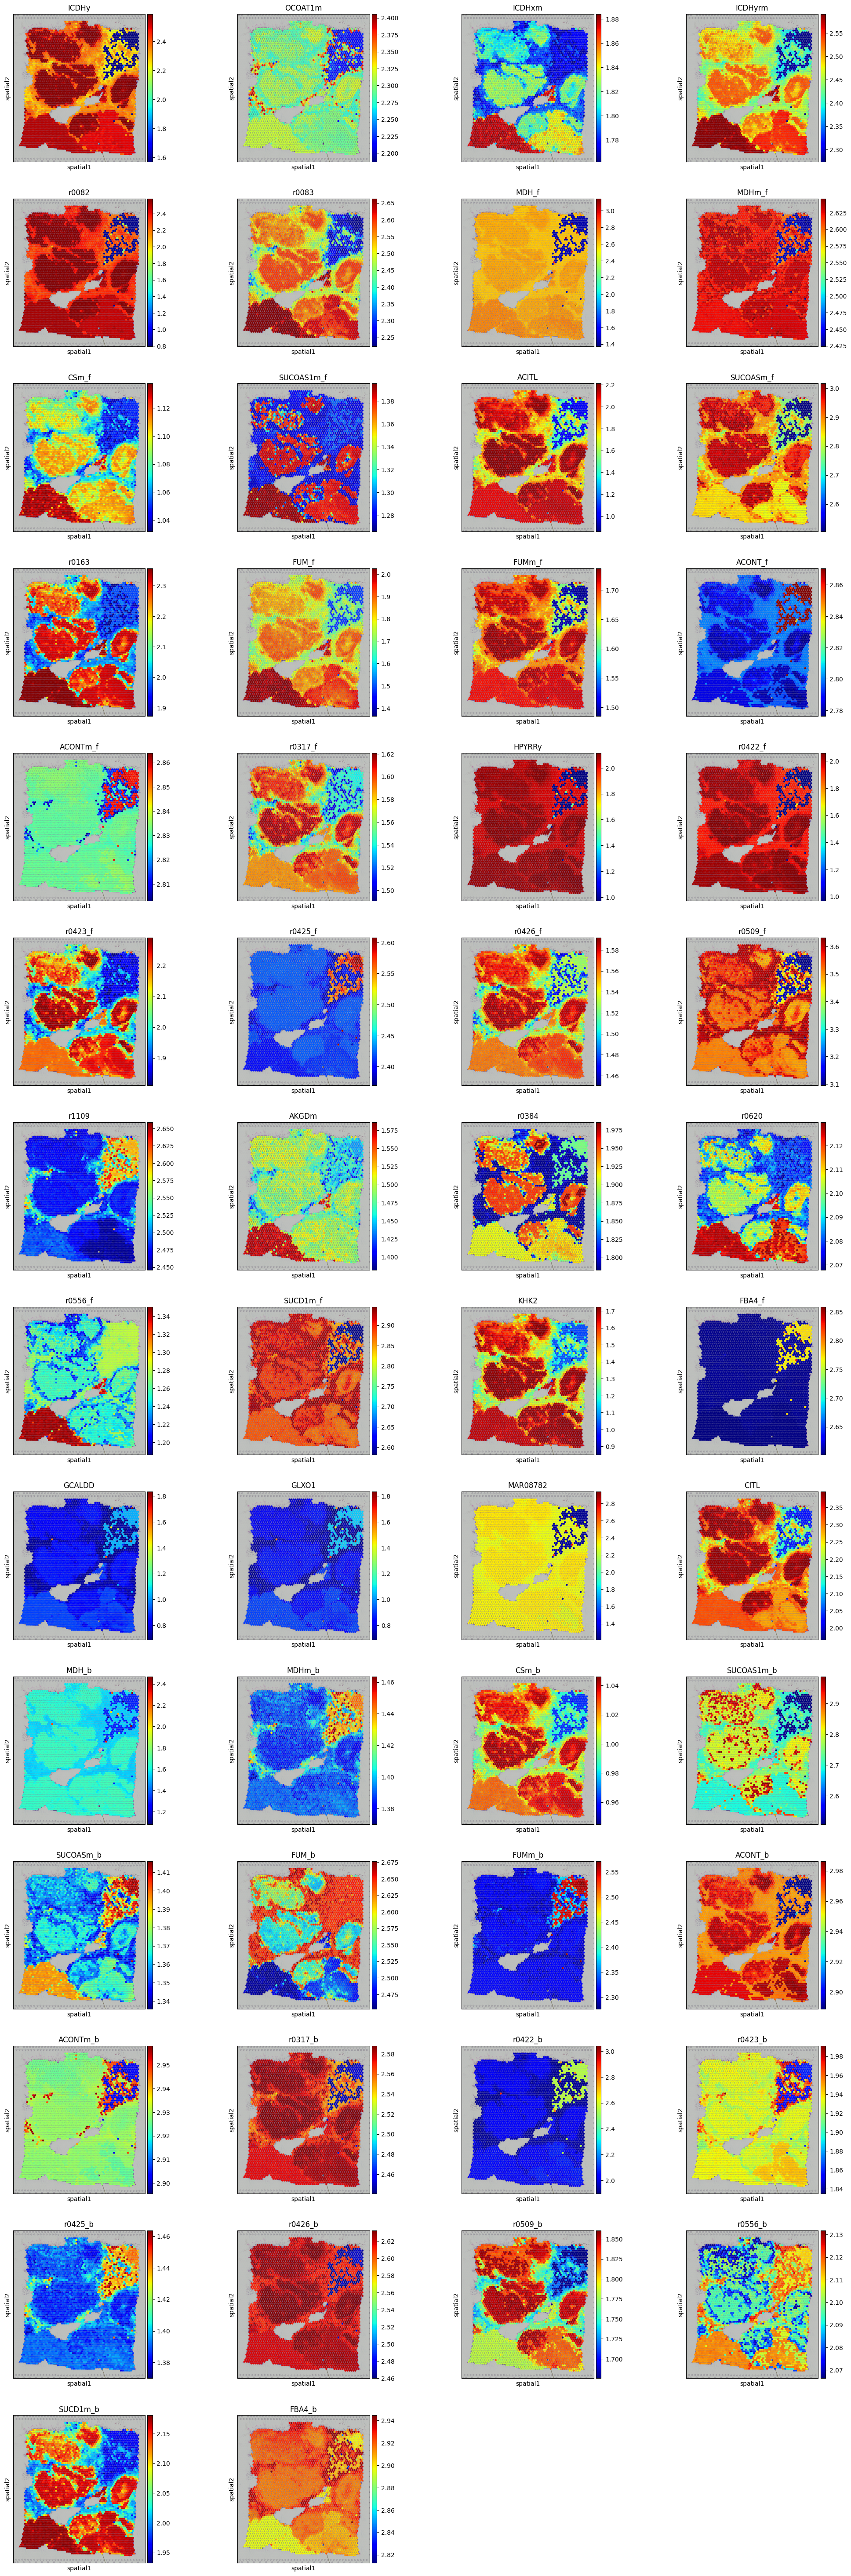
Spatial map view of reactions in Tricarboxylic acid cycle and glyoxylate/dicarboxylate metabolism pathway
[8]:
gly_rxns = metabolic_adata[:,metabolic_adata.var['subsystems'] == "Tricarboxylic acid cycle and glyoxylate/dicarboxylate metabolism"].to_df().columns
sc.pl.spatial(metabolic_adata, img_key = "hires", color = gly_rxns, size=1.5, cmap="jet", wspace=0.0, save="_spatial_TCA_Cycle_Breast_cancer_Block_A.pdf")
WARNING: saving figure to file figures\show_spatial_TCA_Cycle_Breast_cancer_Block_A.pdf
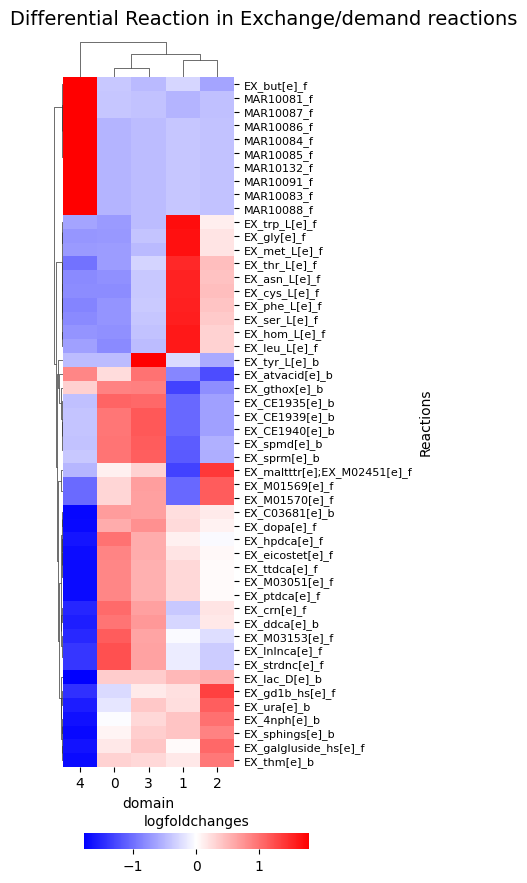
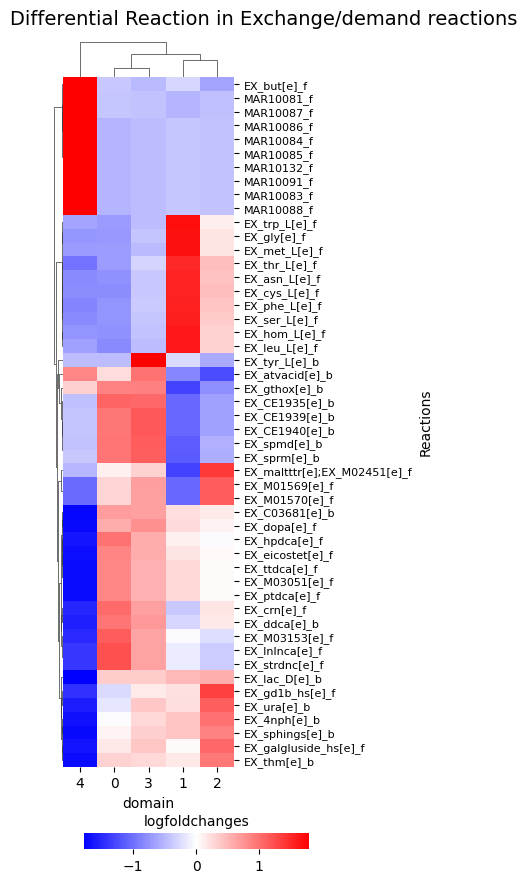
Spatial map view of reactions in Exchange/demand reactions pathway
[9]:
df_exchange = pl.plot_differential_reactions_by_pathway_heatmap(metabolic_adata, "Exchange/demand reactions", row_cluster=True, return_marker_df = True, save_path='ex_reactions_Breast_cancer_Block_A.pdf')
df_exchange
[9]:
| group | names | scores | logfoldchanges | pvals | pvals_adj | |
|---|---|---|---|---|---|---|
| 0 | 0 | EX_crn[e]_f | 43.317997 | 0.010906 | 0.000000e+00 | 0.000000e+00 |
| 1 | 0 | EX_ddca[e]_b | 43.028091 | 0.006805 | 0.000000e+00 | 0.000000e+00 |
| 2 | 0 | EX_ttdca[e]_f | 42.976227 | 0.002487 | 0.000000e+00 | 0.000000e+00 |
| 3 | 0 | EX_M03051[e]_f | 42.975494 | 0.002489 | 0.000000e+00 | 0.000000e+00 |
| 4 | 0 | EX_ptdca[e]_f | 42.975300 | 0.002489 | 0.000000e+00 | 0.000000e+00 |
| ... | ... | ... | ... | ... | ... | ... |
| 4551 | 4 | EX_ptdca[e]_f | -24.447412 | -0.007346 | 5.361623e-132 | 1.440283e-131 |
| 4585 | 4 | EX_ddca[e]_b | -24.447412 | -0.013107 | 5.361623e-132 | 1.440283e-131 |
| 4599 | 4 | EX_sphings[e]_b | -24.447412 | -0.005392 | 5.361623e-132 | 1.440283e-131 |
| 4618 | 4 | EX_thm[e]_b | -24.447412 | -0.269751 | 5.361623e-132 | 1.440283e-131 |
| 4625 | 4 | EX_M03051[e]_f | -24.447412 | -0.007347 | 5.361623e-132 | 1.440283e-131 |
250 rows × 6 columns
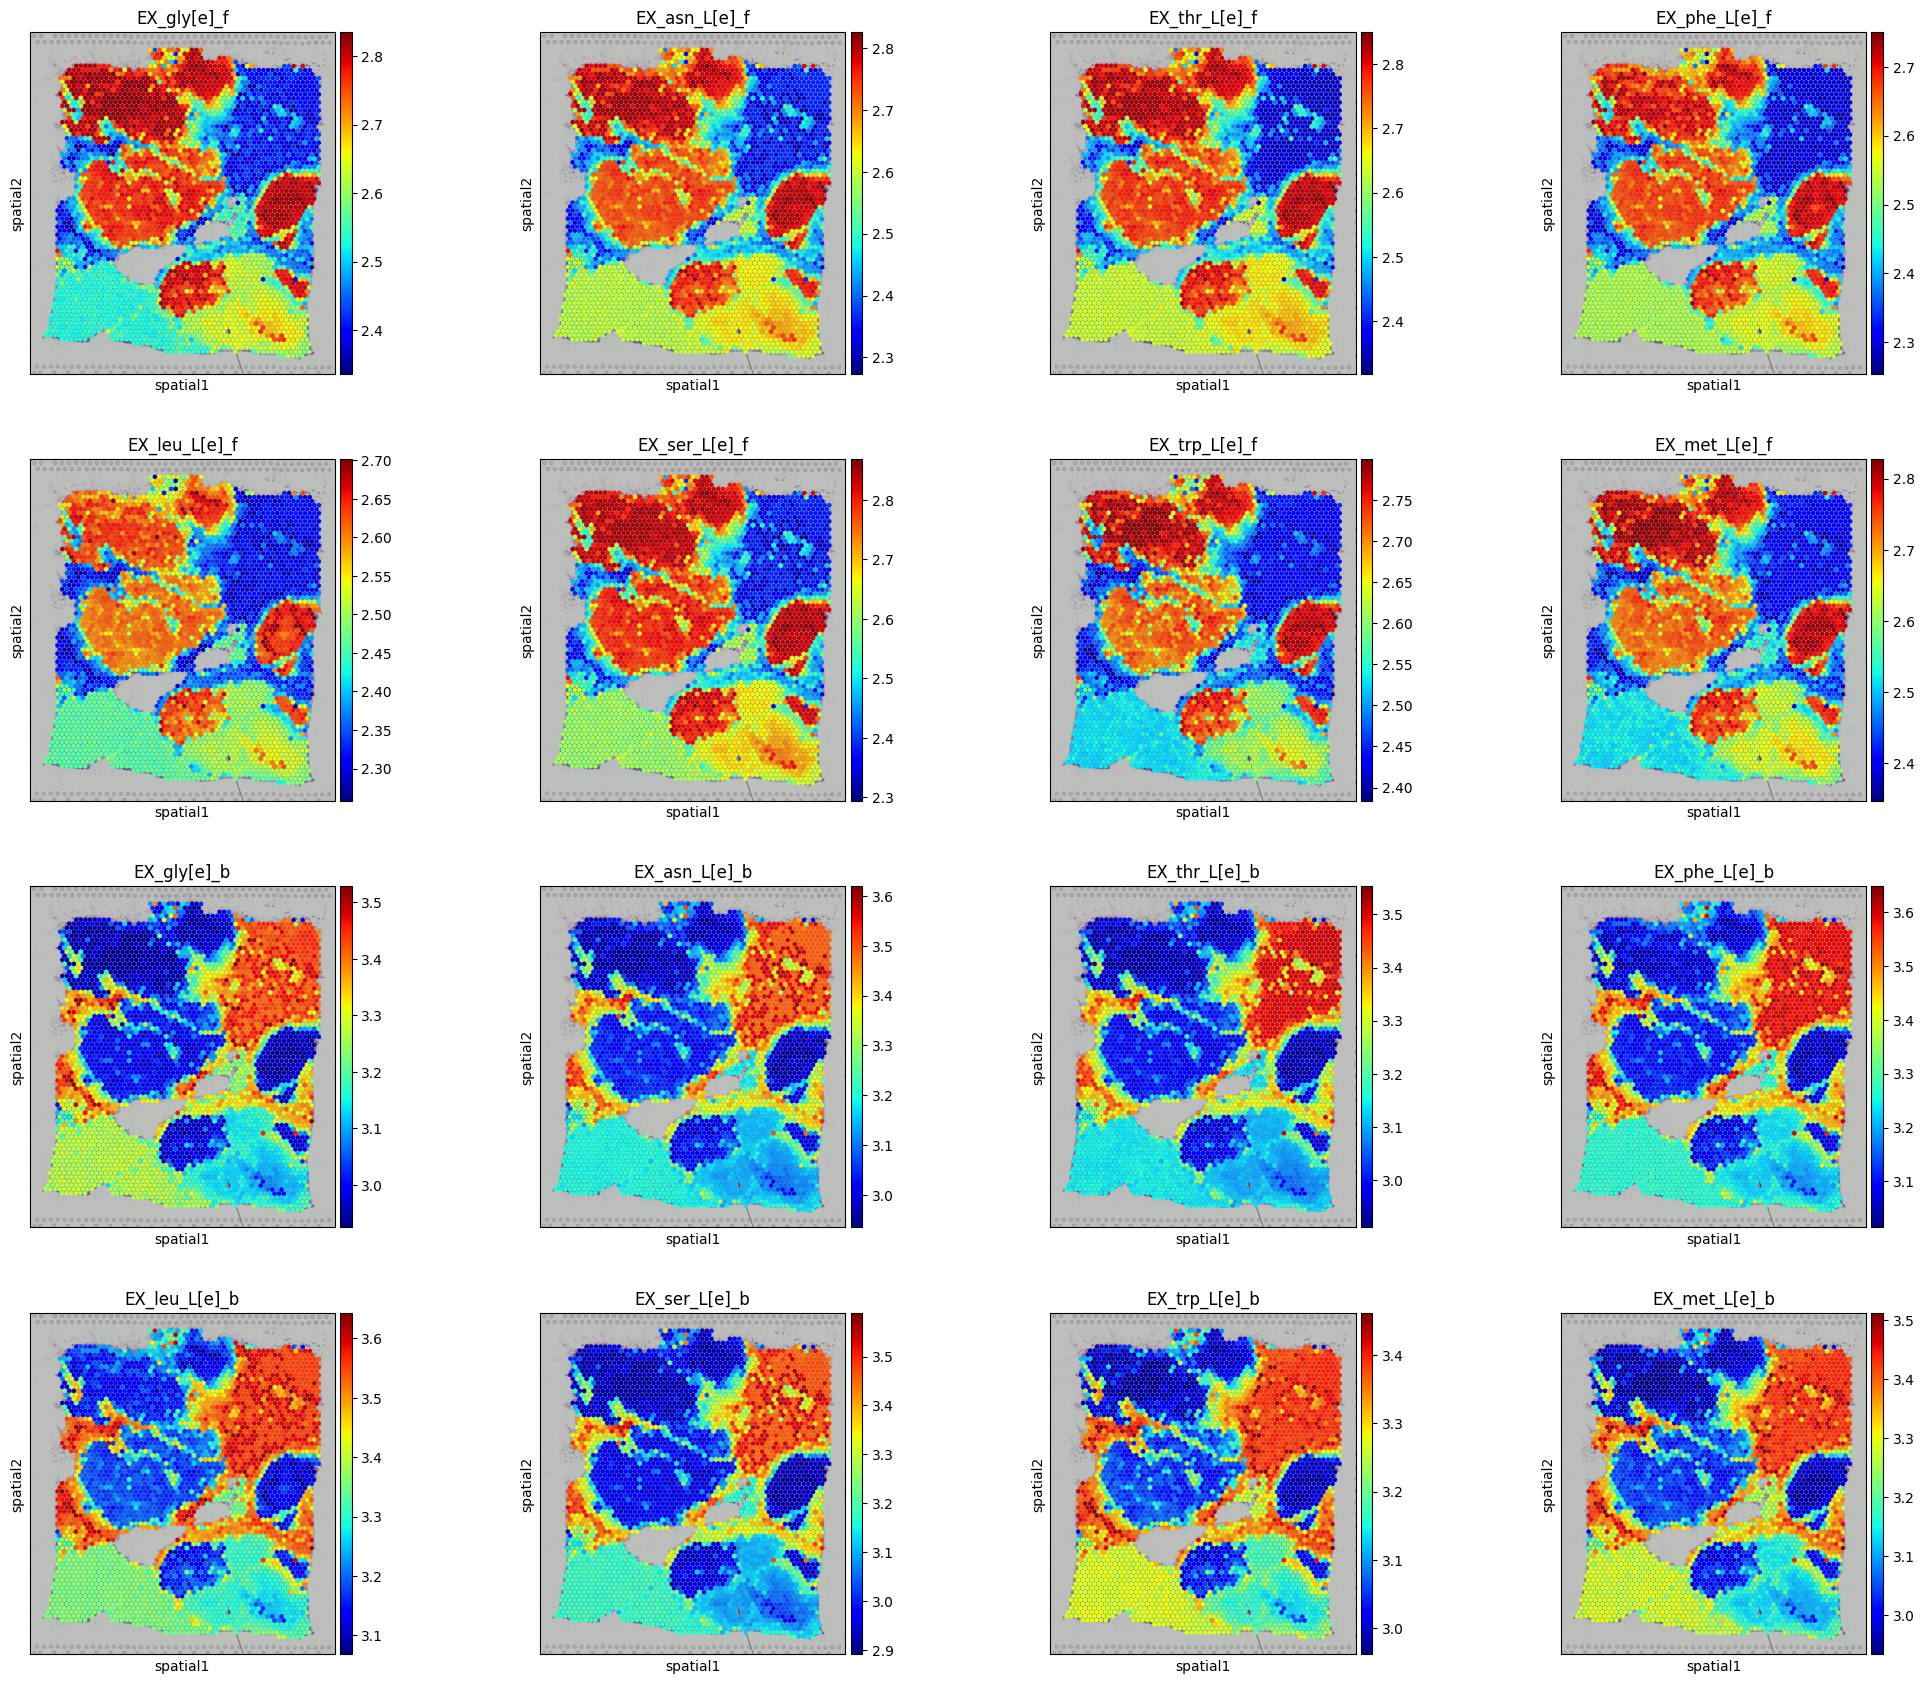
Investigate the spatial fluxes for exchange reactions differentially enriched in domain 1.
[10]:
ex_rxns = ['EX_gly[e]_f','EX_asn_L[e]_f','EX_thr_L[e]_f','EX_phe_L[e]_f','EX_leu_L[e]_f','EX_ser_L[e]_f','EX_trp_L[e]_f','EX_met_L[e]_f',  'EX_gly[e]_b','EX_asn_L[e]_b','EX_thr_L[e]_b','EX_phe_L[e]_b','EX_leu_L[e]_b','EX_ser_L[e]_b','EX_trp_L[e]_b','EX_met_L[e]_b']
sc.pl.spatial(metabolic_adata, img_key = "hires", color = ex_rxns, size=1.5, cmap="jet", wspace=0.0, save="_spatial_exchange_Breast_cancer_Block_A_domain_1.pdf")
WARNING: saving figure to file figures\show_spatial_exchange_Breast_cancer_Block_A_domain_1.pdf
Domain-Specific Differentially Enriched Reactions
Highlight individual metabolic reactions with the largest flux differences across domains:
Statistical Testing: Identifies significantly different reactions
Heatmap Display: Visualizes flux patterns for marker reactions across domains
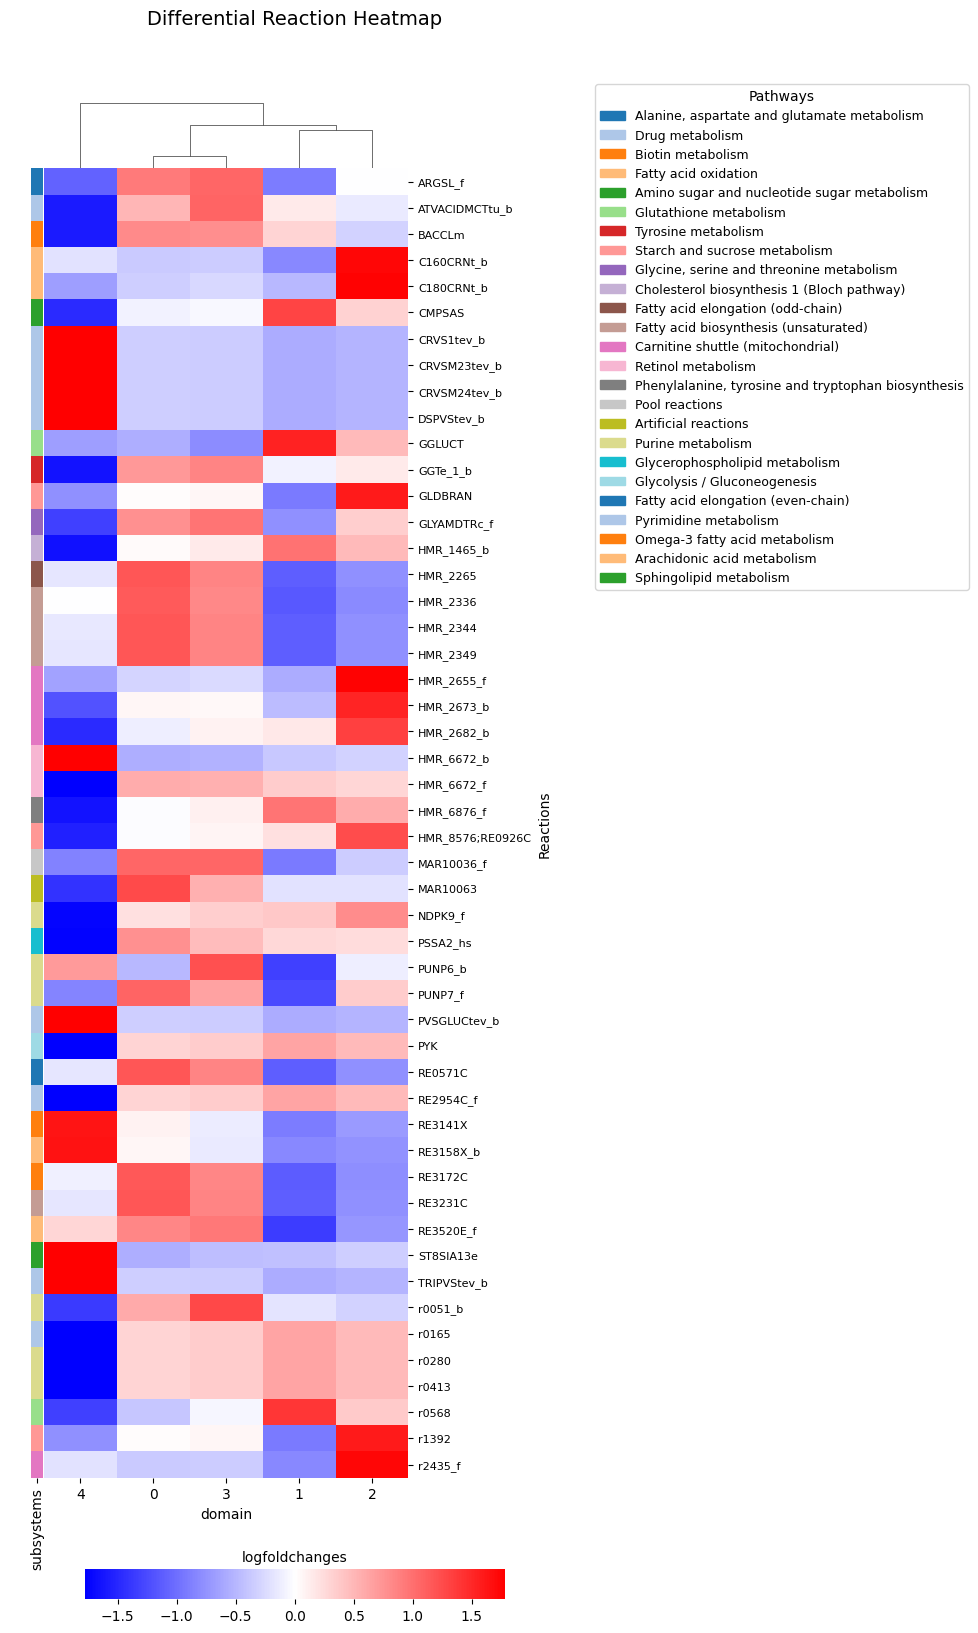
Pathway-level Analysis: Aggregate reaction information into functional pathway categories
Identify differentially enriched reactions grouped by pathways
[11]:
pl.plot_differential_reactions_heatmap(metabolic_adata, save_path="Differential_reactions_Breast_cancer_Block_A.pdf")
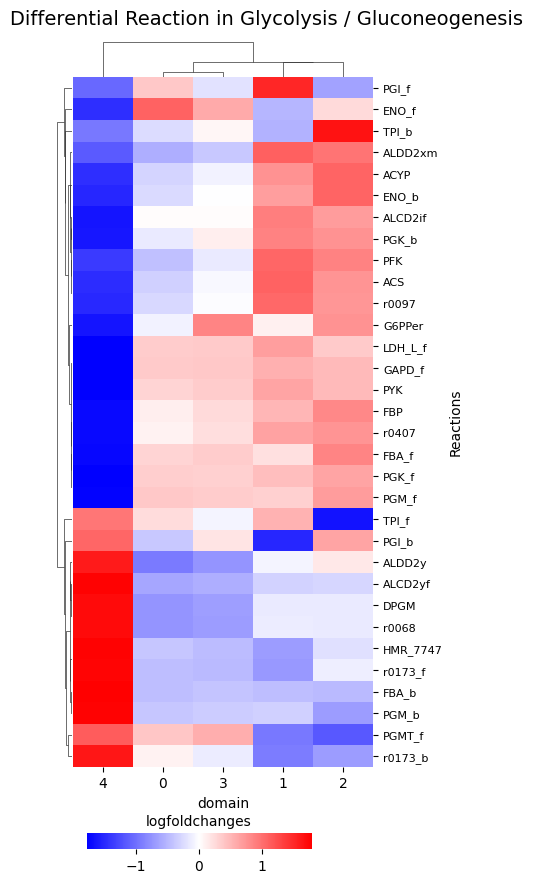
Investigate Glycolysis/Gluconeogenesis Pathway
Deep dive into glucose metabolism, a key pathway in cancer biology. Understanding glycolytic heterogeneity helps explain differential cell behavior in the tumor microenvironment.
[12]:
df = pl.plot_differential_reactions_by_pathway_heatmap(metabolic_adata, "Glycolysis / Gluconeogenesis", row_cluster=True, return_marker_df = True, save_path="glycolysis_reactions_Breast_cancer_Block_A.pdf")
Investigate Exchange/demand reactions Pathway
[13]:
df_exchange = pl.plot_differential_reactions_by_pathway_heatmap(metabolic_adata, "Exchange/demand reactions", row_cluster=True, return_marker_df = True)#, save_path='ex_reactions_Breast_cancer_Block_A.pdf')
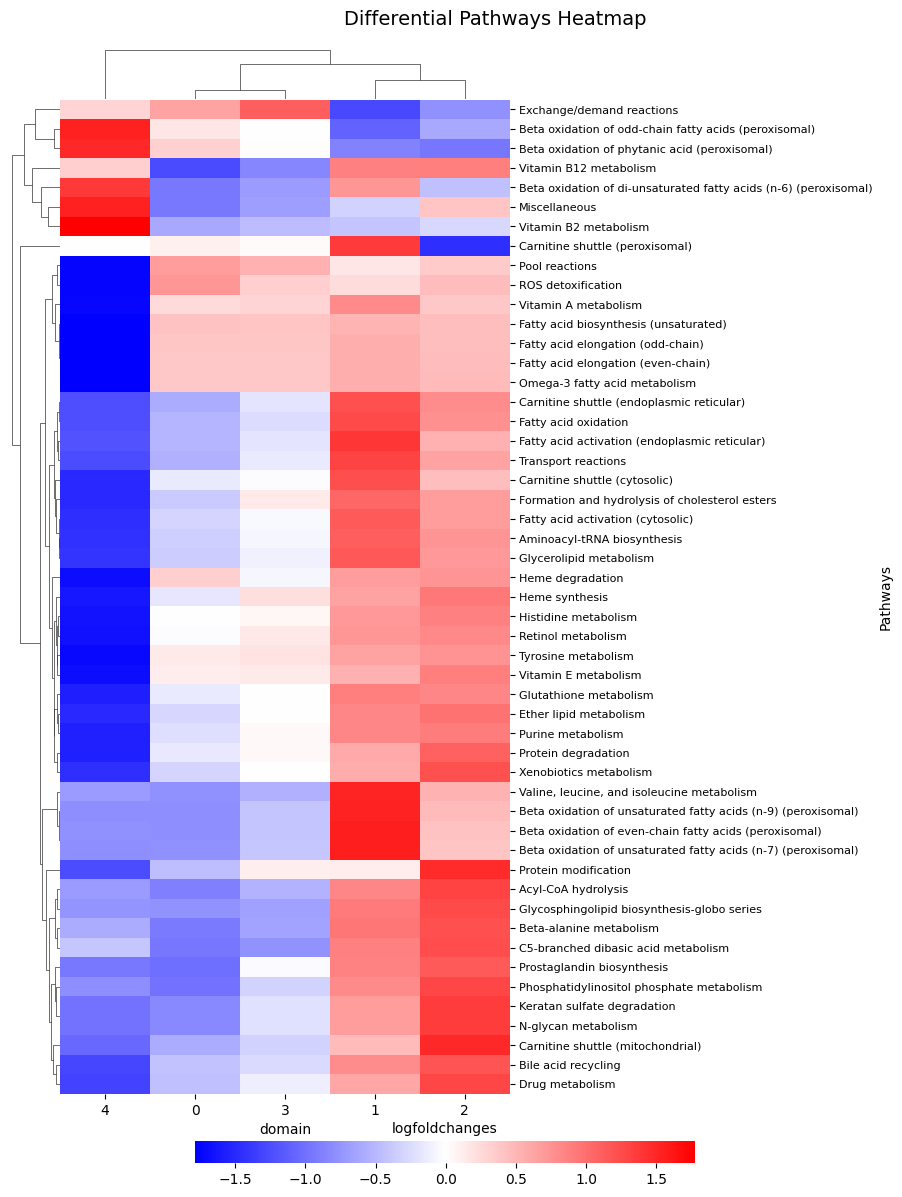
Investigate differentially enriched top 15 pathways
[14]:
pl.plot_differential_pathways_heatmap(metabolic_adata, save_path="Differential_pathways_Breast_cancer_Block_A.pdf")
Investigate top 20 Pathways by variance
[15]:
pl.plot_pathways_flux_heatmap(metabolic_adata, group_key="domain", pathway_key="subsystems", top_n=20, sort_by='variance')